Informational

Data use:

We use cookies and similar tools to make your use of this website easy and to keep it working properly. We may share data about you and how you use the site with third parties, such as analytics and marketing partners. Learn more in our Privacy Policy and Terms of Use. By continuing to use the site, you agree to this.

Article

Split benefits obscure specialty spend

Integrated specialty management unifies visibility and can reduce costs by shifting eligible medical claims to the pharmacy benefit.

September 28, 2026 | 6-minute read

In this article

Although specialty medications account for only about 2% of prescriptions, they represent more than half of total drug spending.

Spending continues to increase as new therapies enter the market.1 Industry analysts expect specialty medications to remain the biggest driver of pharmacy benefit costs over the next one to three years.2

What are specialty drugs?

Specialty drugs are high-cost medications used to treat complex, chronic, rare or life-threatening conditions and often require specialized handling, administration, monitoring and patient support. 

New drugs, familiar patterns mark specialty spending

New therapies continue to enter the market, but the main drivers of specialty spending have changed little in recent years.

Key drivers include:3

  • Immunology
  • Oncology
  • Rare disease treatments
  • Multiple sclerosis therapies

Cell and gene therapies represent a growing financial risk because of their exceptionally high per-patient costs.4

GLP-1 medications are also reshaping benefit strategy because of their rapid growth in demand and spending. While GLP-1s are not traditionally considered specialty medications, they are frequently included in discussions about specialty drug costs.5

For many organizations, specialty management has evolved from a niche activity into a strategic priority.

Understanding total specialty drug spend is complicated

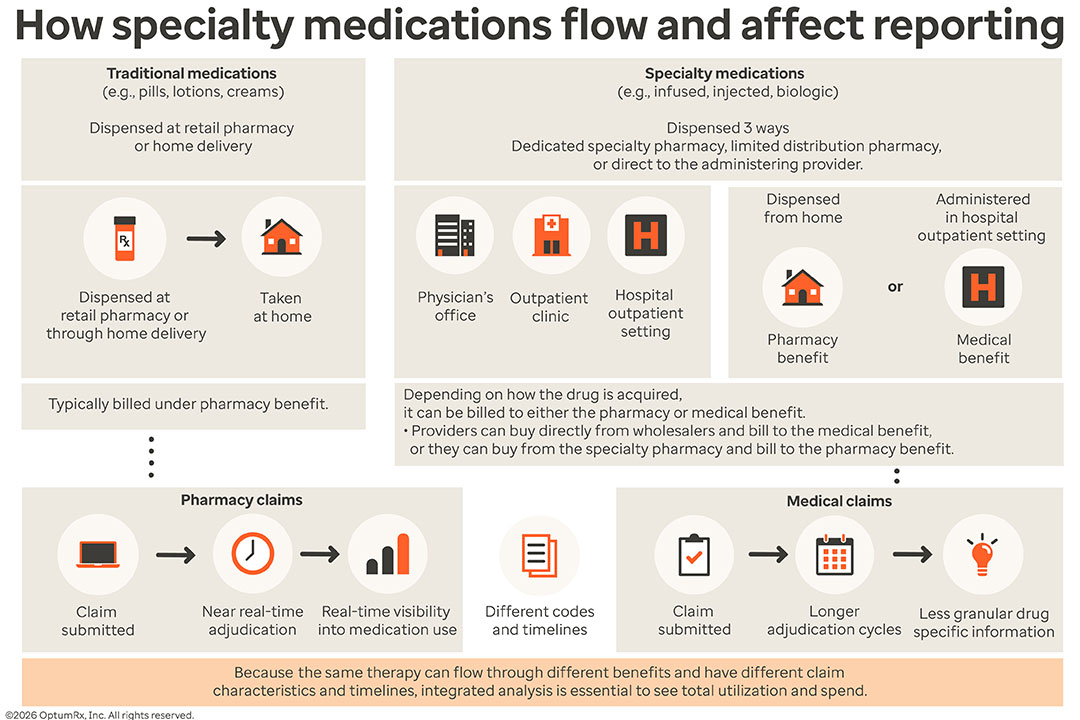
Understanding total drug spending can be difficult because costs are often split between pharmacy and medical benefits.

For example, oncology is one of the largest pharmacy benefit categories. However, about 80% of total oncology spending occurs under the medical benefit.6

Many organizations use different vendors to administer pharmacy and medical benefits. Each vendor may use different systems, reporting methods and payment arrangements.

As a result, employers may have detailed information for each benefit but still lack a complete view of total medication spending.

Why are specialty drugs covered under medical benefit?

Another challenge is that specialty medications can be administered in different settings.

Self-administered medications are typically covered under the pharmacy benefit. However, many specialty therapies are given in a physician's office, infusion center or hospital outpatient department. These medications are often billed through the medical benefit.

The same drug may be covered under either benefit depending on where it is delivered. This can make spending patterns difficult to track and compare.

How specialty medications flow and affect reporting How specialty medications flow and affect reporting

Dedicated specialty pharmacies play a key role in managing how certain drugs are delivered but may introduce additional reporting complexities of their own. For example, the same therapy may be dispensed through a specialty pharmacy for home administration under the pharmacy benefit or administered in a hospital outpatient setting under the medical benefit. 

This benefit migration can obscure utilization trends, complicate cost comparisons and make it difficult to identify the true drivers of specialty drug spending. 

Reporting challenges

Pharmacy and medical claims are also reported differently.

Pharmacy claims are typically available in near real time and provide detailed information about medication use.

Medical claims often take longer to process and may contain less drug-specific detail.

These differences can:

  • Limit visibility into spending
  • Delay identification of cost drivers
  • Create duplicate-counting risks
  • Make reporting less accurate

Why it matters

Without an integrated view of medical and pharmacy claims, plan sponsors may underestimate specialty drug costs.

They may also miss opportunities to:

  • Optimize site of care
  • Improve provider reimbursement strategies
  • Strengthen clinical management programs
  • Reduce unnecessary spending

As specialty costs continue to grow, many organizations are adopting integrated analytics to better understand total drug spend.

How Optum Rx can help

Optum Rx brings medical and pharmacy data together into a single view.

This integrated approach can help plan sponsors:

  • Better understand total specialty spending
  • Identify savings opportunities
  • Improve care management
  • Support better patient outcomes

By moving eligible claims from the medical benefit to the pharmacy benefit, organizations may gain greater visibility and stronger cost controls.

Here are a few specific programs that are available to clients to help manage specialty costs:

Specialty Fusion combines clinical, financial and utilization management strategies across pharmacy and medical benefits.

The program is designed to:

  • Improve visibility into specialty spending
  • Support clinical decision-making
  • Identify the most appropriate benefit
  • Recommend the most cost-effective site of care
  • Apply available rebates and savings opportunities

Depending on existing specialty management programs, clients may achieve savings of up to $15 PMPM.

Specialty Medication Optimization focuses on professionally administered specialty medications.

The program can help:

  • Create a more consistent pricing approach
  • Reduce site-of-care variation
  • Increase visibility into spending
  • Identify savings opportunities

Potential savings can reach up to $4.64 PMPM.

For example:

  • Benlysta® may cost about $3,000 to $4,000 in office or home infusion settings but nearly $6,000 in a hospital outpatient setting.
  • Entyvio® may cost about $8,000 in office or home infusion settings and up to $13,000 in hospital outpatient settings.

Estimated savings can reach:

  • Up to $3,700 per Benlysta claim
  • Up to $6,400 per Entyvio claim

Plan sponsors gain greater control and insight into specialty spend while preserving provider choice and supporting timely access to treatment.
Conclusion

Specialty medications are expected to remain the largest driver of pharmacy benefit costs over the next one to three years.

As spending continues to grow, plan sponsors will need strategies that balance affordability, access and clinical outcomes.

Integrated pharmacy and medical benefit management can provide a more complete view of specialty spending while helping organizations identify opportunities to improve care and manage costs.

Through specialty pharmacy management, biosimilar strategies, integrated benefits, analytics and patient support programs, Optum Rx helps clients navigate an increasingly complex specialty drug landscape.

Industry insights

View all
4 Myths: Carving Out Specialty Pharmacy [White Paper]

White paper

4 myths: Carving out specialty pharmacy

We examine the impact of carve-out approaches, how these carve-outs work against patient experience and clinical value, and how the integrated Optum Rx approach works better for all stakeholders.

Specialty Drug Management and Patient Follow-up

Article

Specialty drugs: Not just set and forget?

For optimizing specialty drug therapy, monitoring patients throughout their care is key to cost-effective use of high-cost drugs.

Optum Rx Specialty Standards Program

E-book

Get immediate savings on specialty drugs

Specialty drug spend is a “top threat” to employer-provided benefits. Discover sustainable savings with your existing Optum Rx plan.

Sources

  1. AJMC. AMCP 2026 Spotlights New Era for Specialty Drug Market. Published April 23, 2026. Accessed July 30, 2026.
  2. Pharmaceutical Strategies Group. 2026 Trends in Specialty Drug Benefits Report. Published April 27, 2026. Accessed July 30, 2026.
  3. Brown & Brown. PharmaLogic® Spotlight: Pharmacy Benefit Trends Shaping 2026 – Edition 3. Published July 20, 2026. Accessed July 30, 2026.
  4. PhRMA. New report shows promising pipeline for cell and gene therapies, but access challenges persist. Published March 5, 2026. Accessed July 30, 2026.
  5. UnitedHealthcare. Pharmacy forces shaping employer benefit strategies in 2026. Published March 27, 2026. Accessed July 30, 2026.
  6. AJMC. AMCP 2026 Spotlights New Era for Specialty Drug Market. Published April 23, 2026. Accessed July 30, 2026.

Note: All Optum program statistics based on Optum internal analysis.