
White paper

Drive improved outcomes and lower costs for blood cancers with CAR T therapy

This white paper analyzes CAR T utilization, outcomes and economic impact across commercial and Medicare populations in the Optum Cell and Gene Therapy (CGT) program from 2022–2024.

June 29, 2026 | 10-minute read

In this article

Executive summary

Chimeric antigen receptor T-cell (CAR T) therapy is a transformative, gene-based immunotherapy for select blood cancers, offering curative potential for patients with relapsed or refractory disease.

Utilization trends

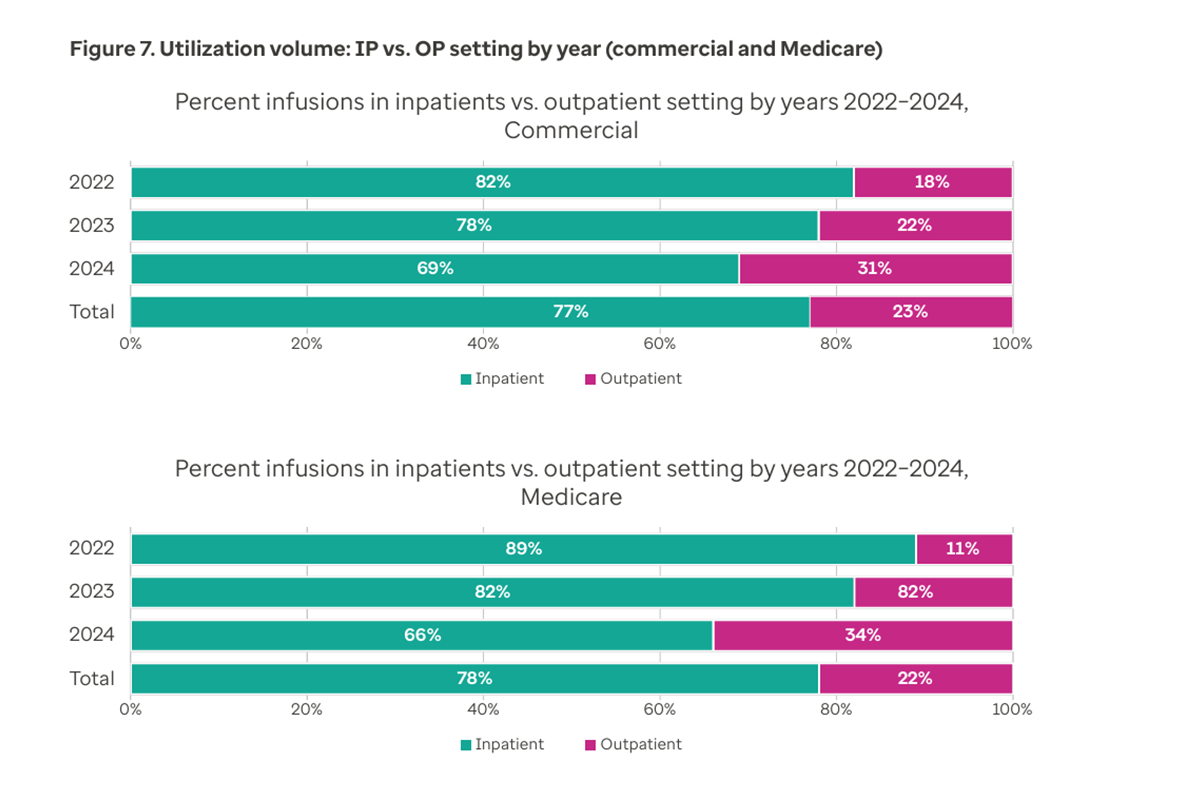
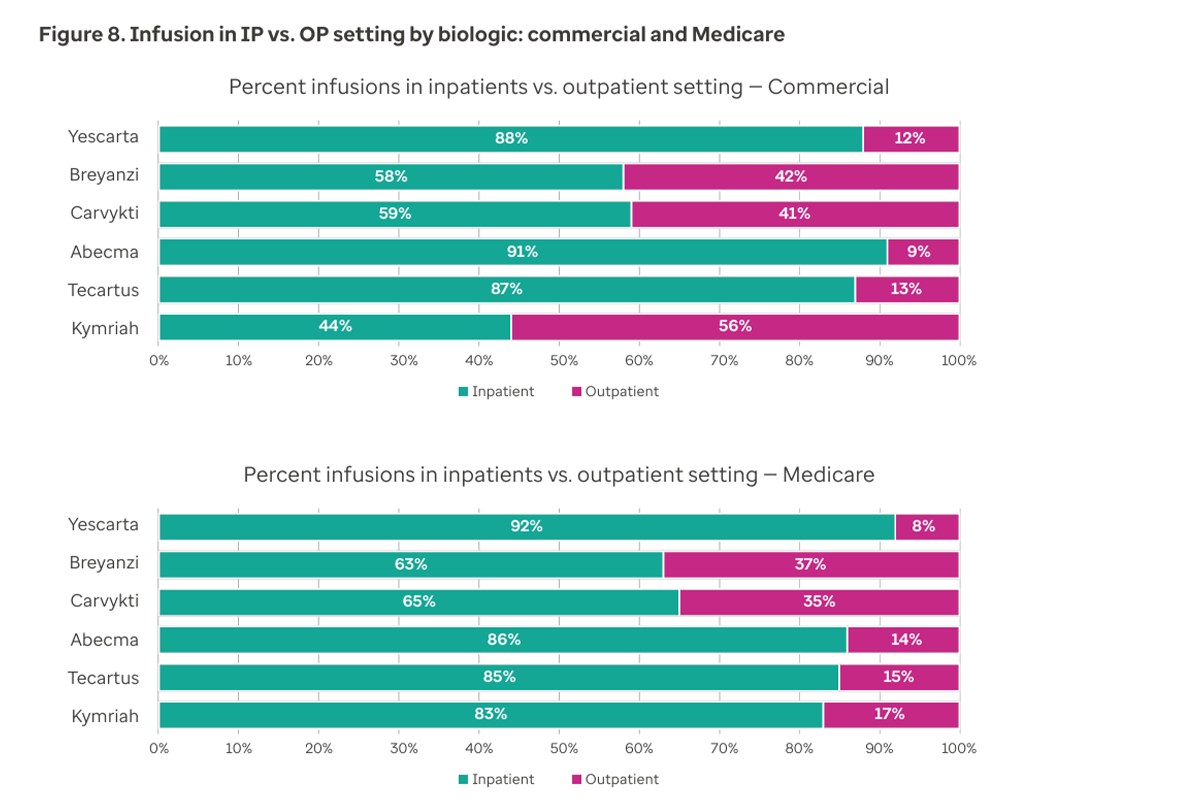
  • A shift in CAR T therapy site of care from inpatient to outpatient can be observed in the utilization data. Based on our analysis of CAR T cases from 2022 to 2024, 31% of all the 2024 commercial cases are in the outpatient setting, compared with 18% in 2022.
  • A similar shift toward outpatient setting (from 11% in 2022 to 34% in 2024) was also seen in the Medicare population.
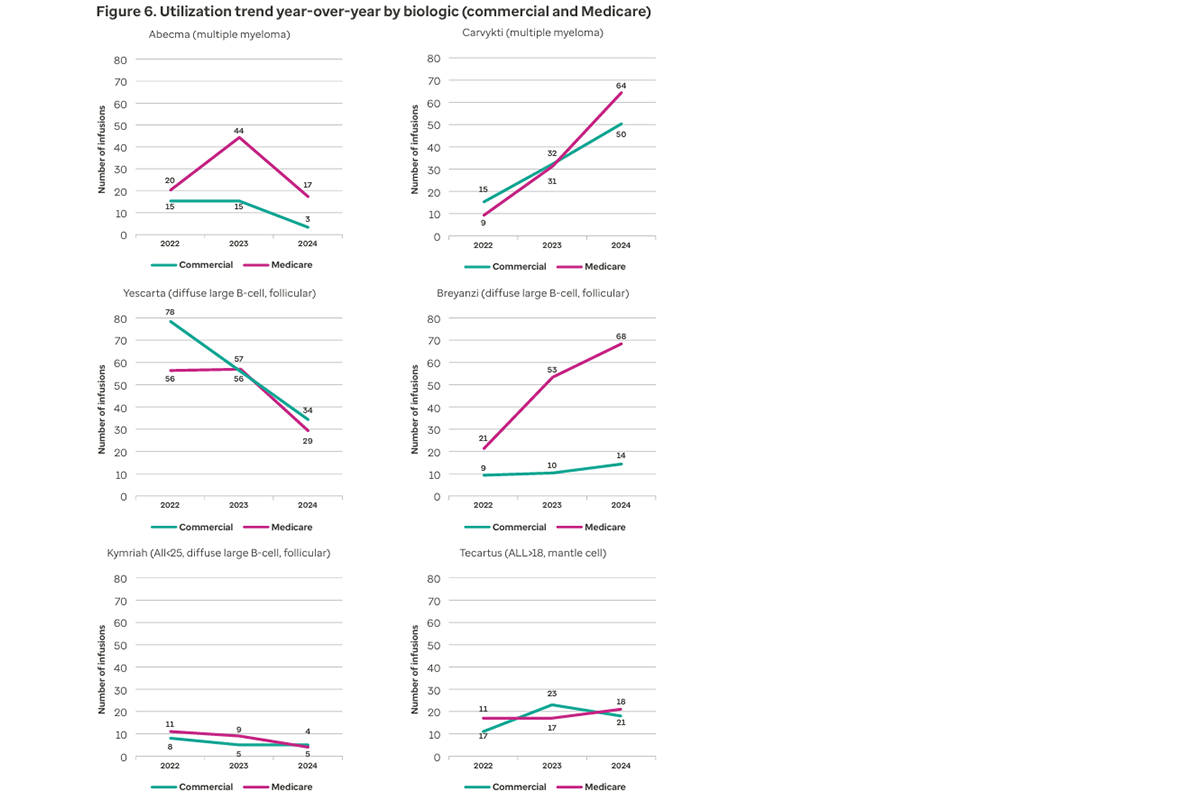
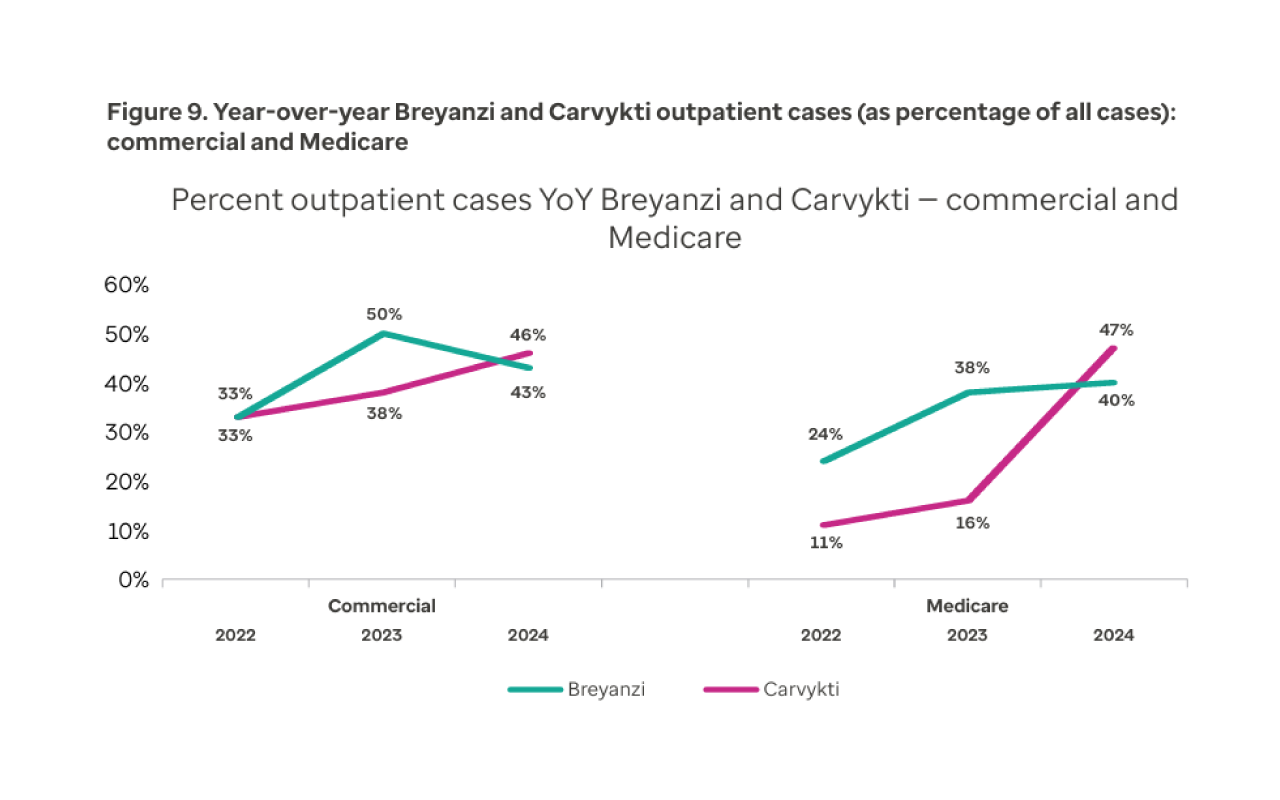
  • Biologic utilization patterns continue to change as providers gain experience with certain biologics and new agents enter the market.

For diffuse large B-cell lymphoma, the use of Breyanzi® has increased over the analysis period, while Yescarta® has decreased for both the commercial and Medicare populations. For multiple myeloma, Carvykti® utilization has increased year-over-year, with decreased use of Abecma® in both the commercial and Medicare populations.

Post-infusion outcomes

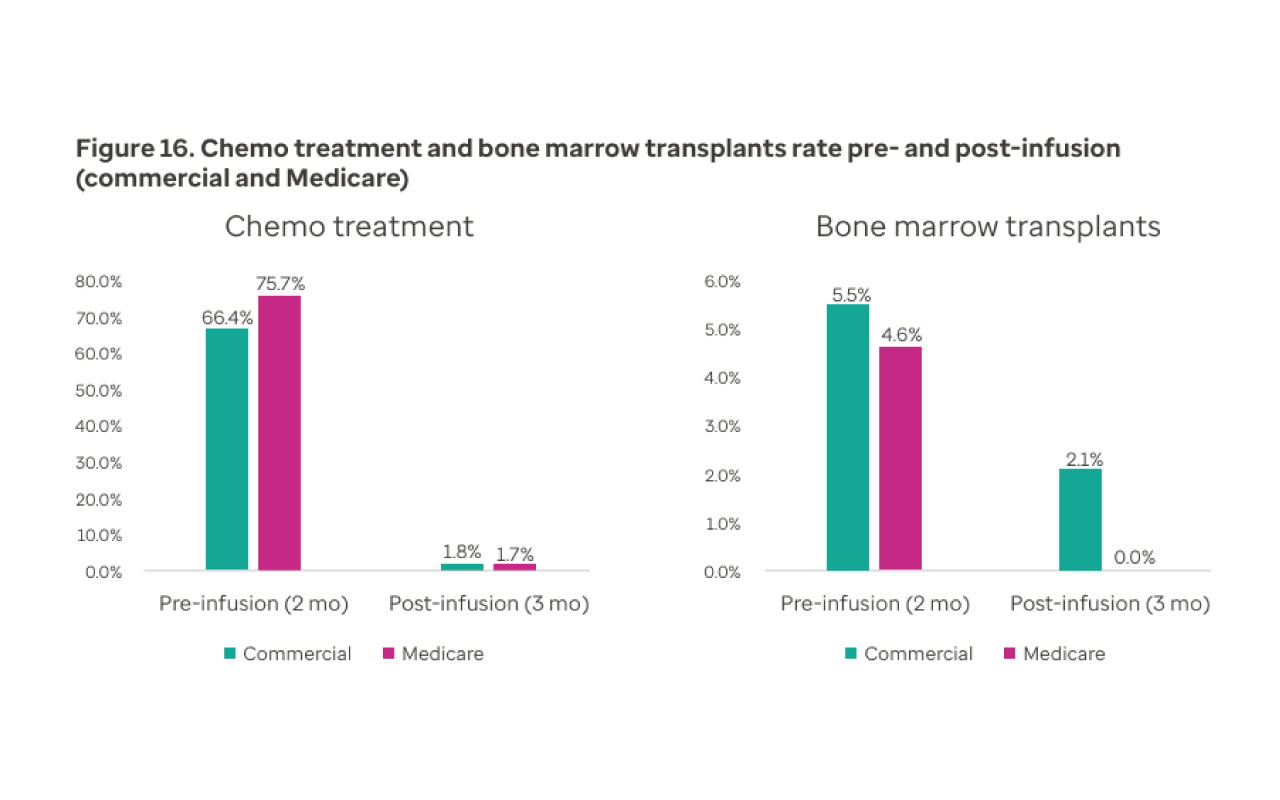
  • Our data indicate CAR T therapy reduces the need for subsequent chemotherapy or bone marrow transplant. Only 1.8% of commercial and 1.7% of Medicare patients in our study needed chemotherapy within 3 months post-infusion. These findings support the efficacy of CAR T therapies in maintaining remission and are consistent with prior real-world analyses.1
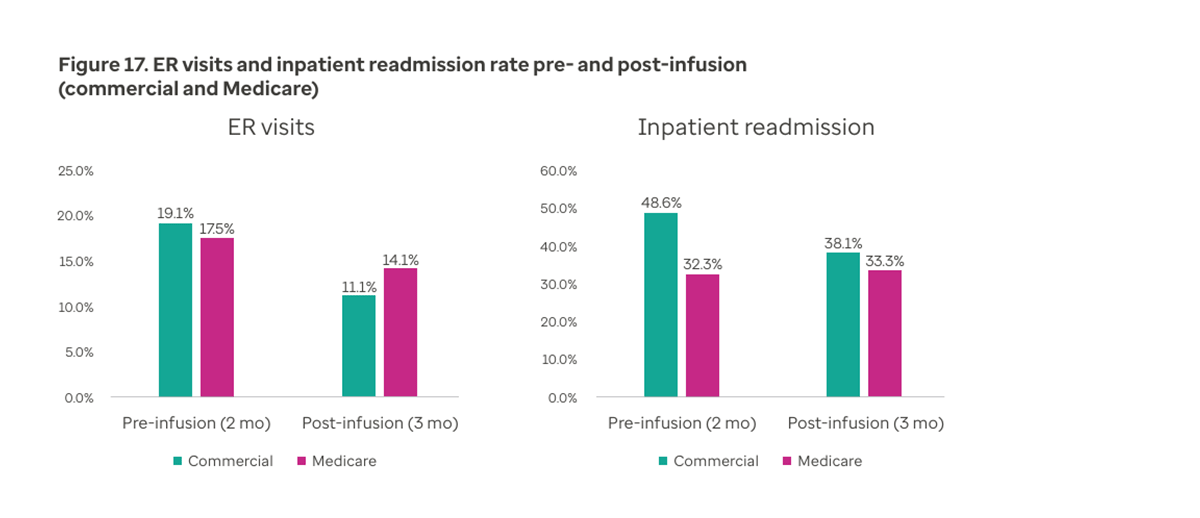
  • Consistent with another reference,2 patients in our study experienced fewer emergency room visits and hospital readmissions within 3 months post-infusion compared with 3 months pre-infusion, indicating improved stability with fewer complications compared with the period before treatment.
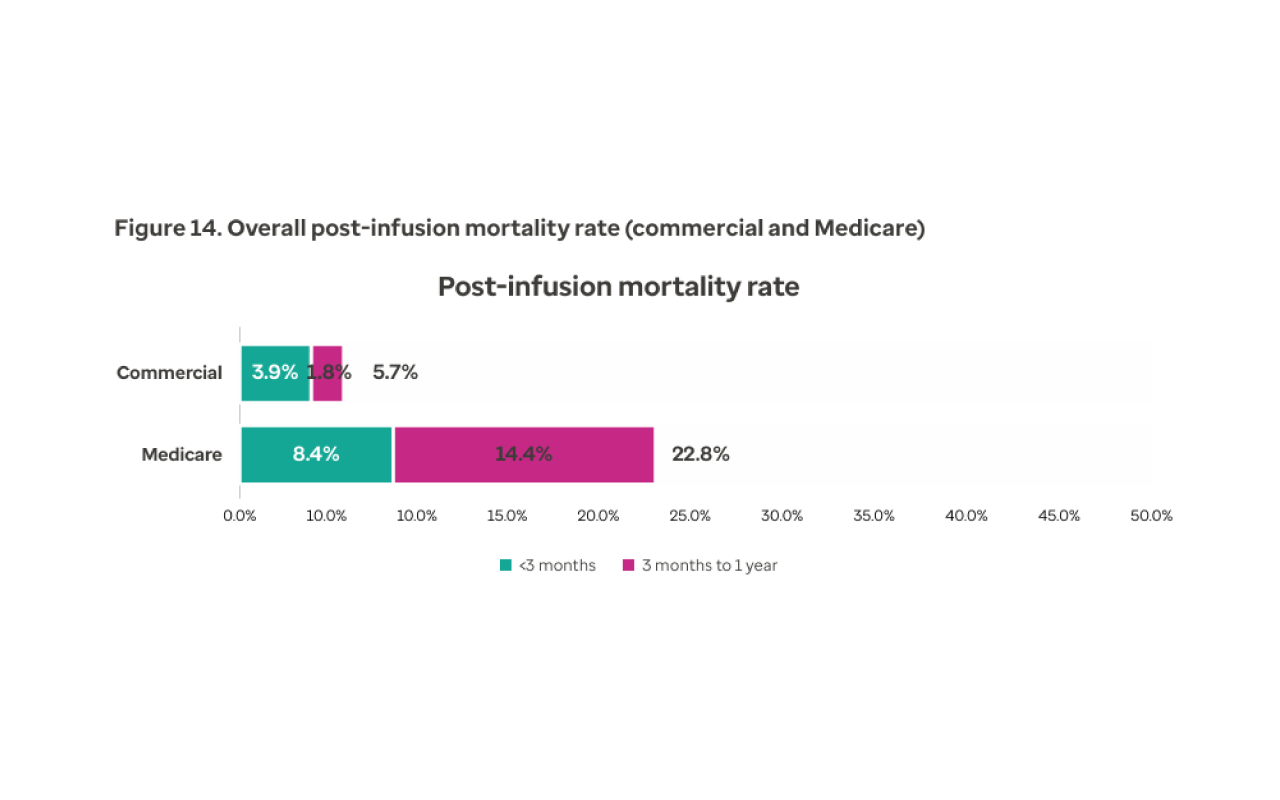
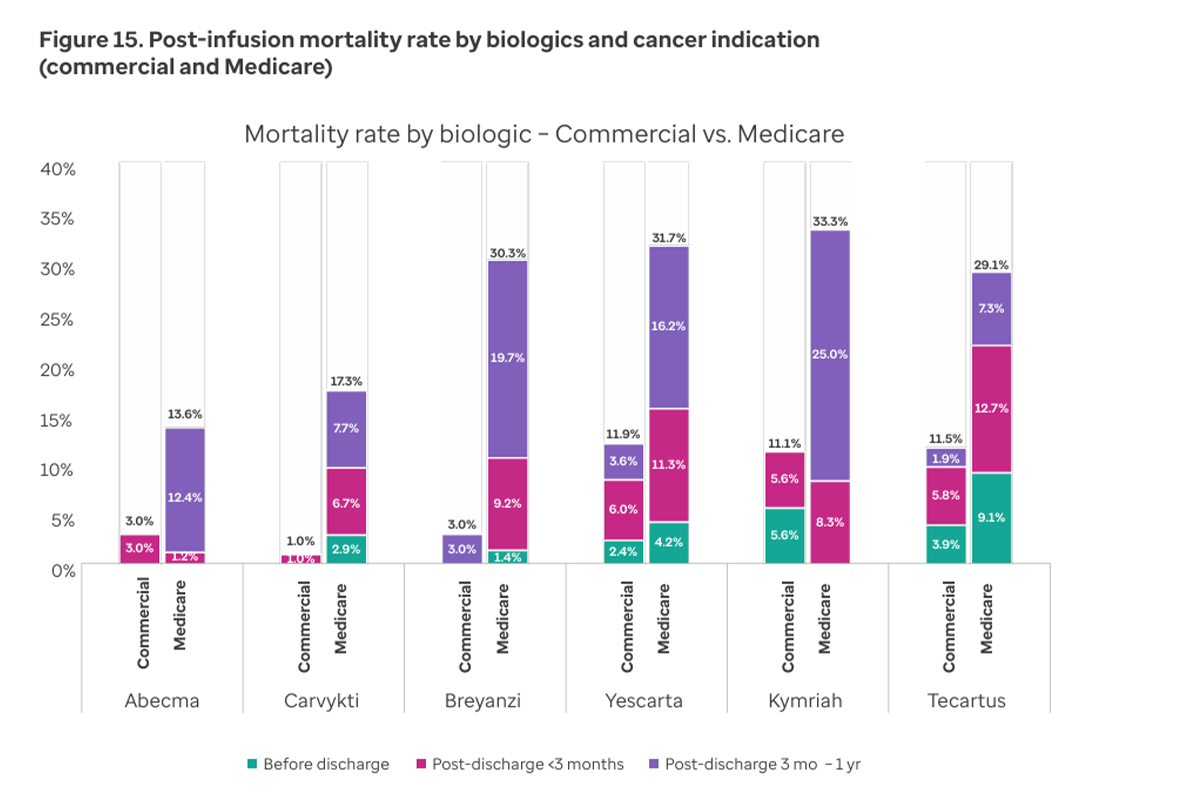
  • Mortality rates within 3 months of discharge remained in the single digits — 3.9% for commercial and 8.4% for Medicare populations. These findings indicate that CAR T therapy is generally safe, including for older adults and other higher risk patients.
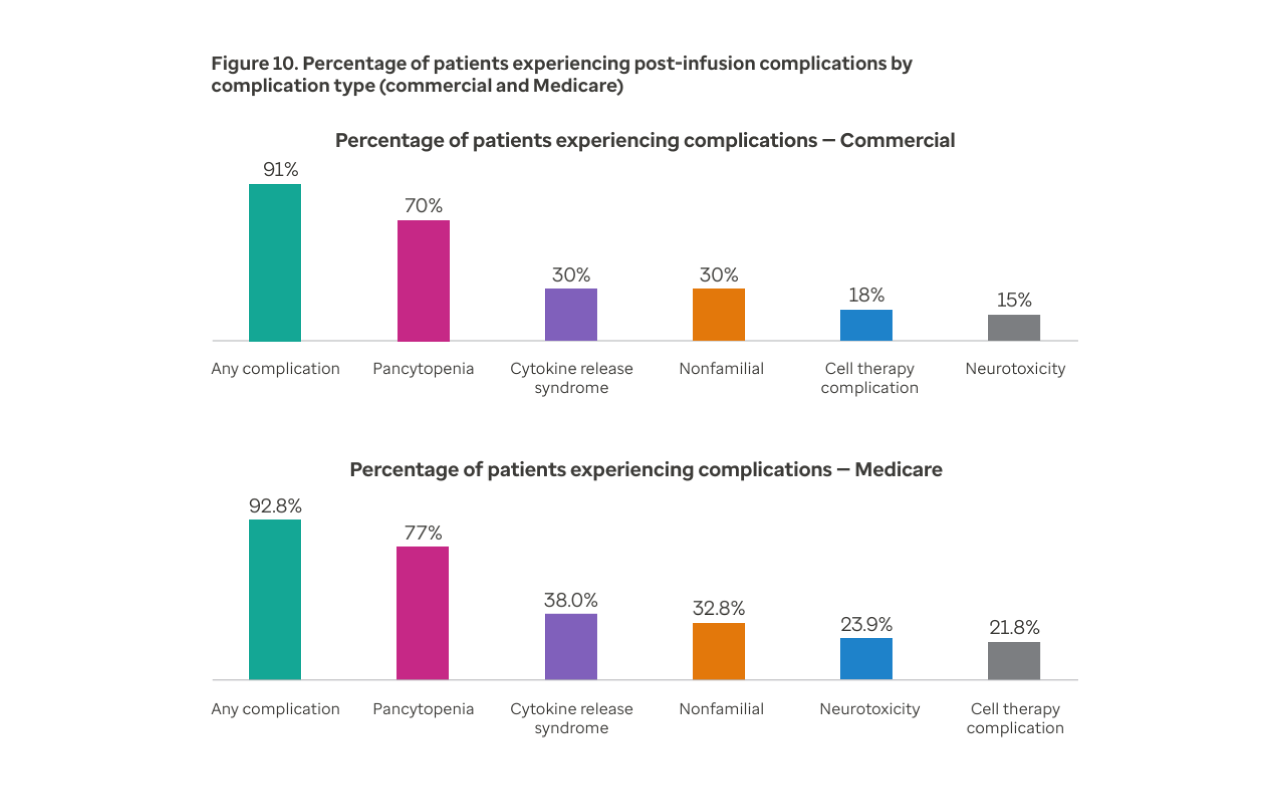
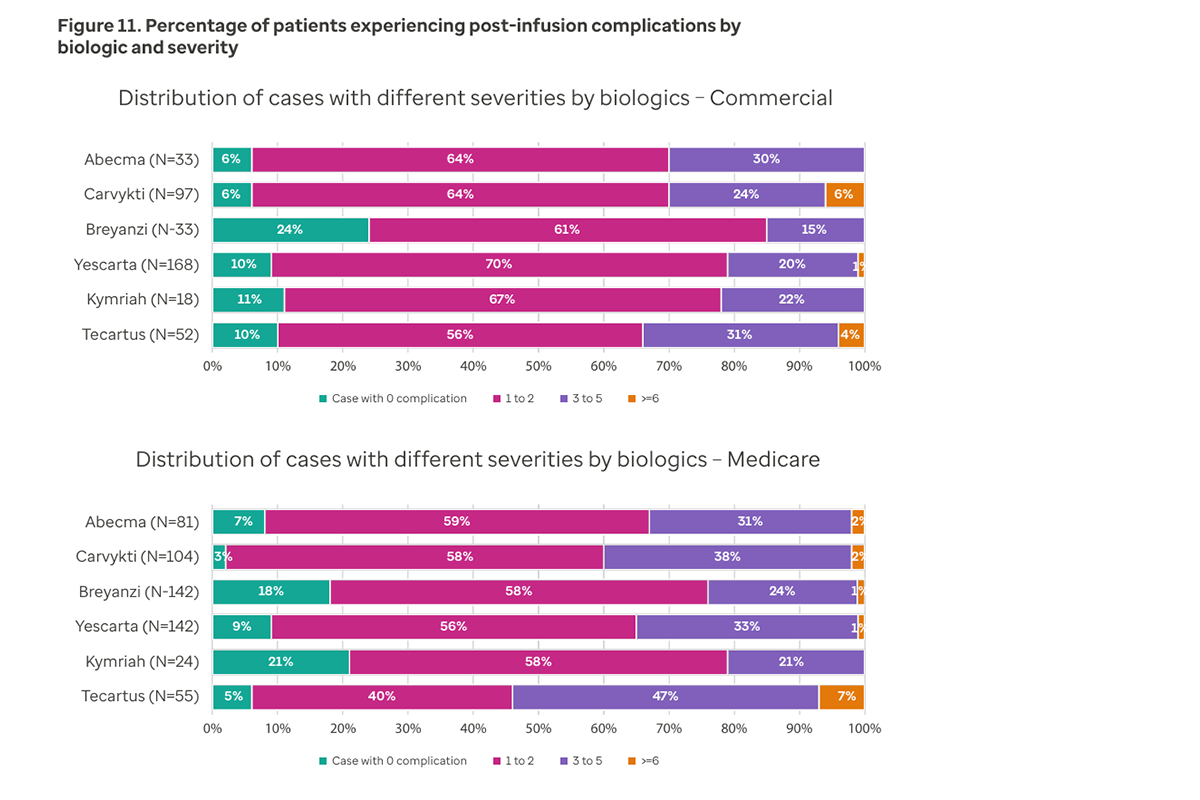
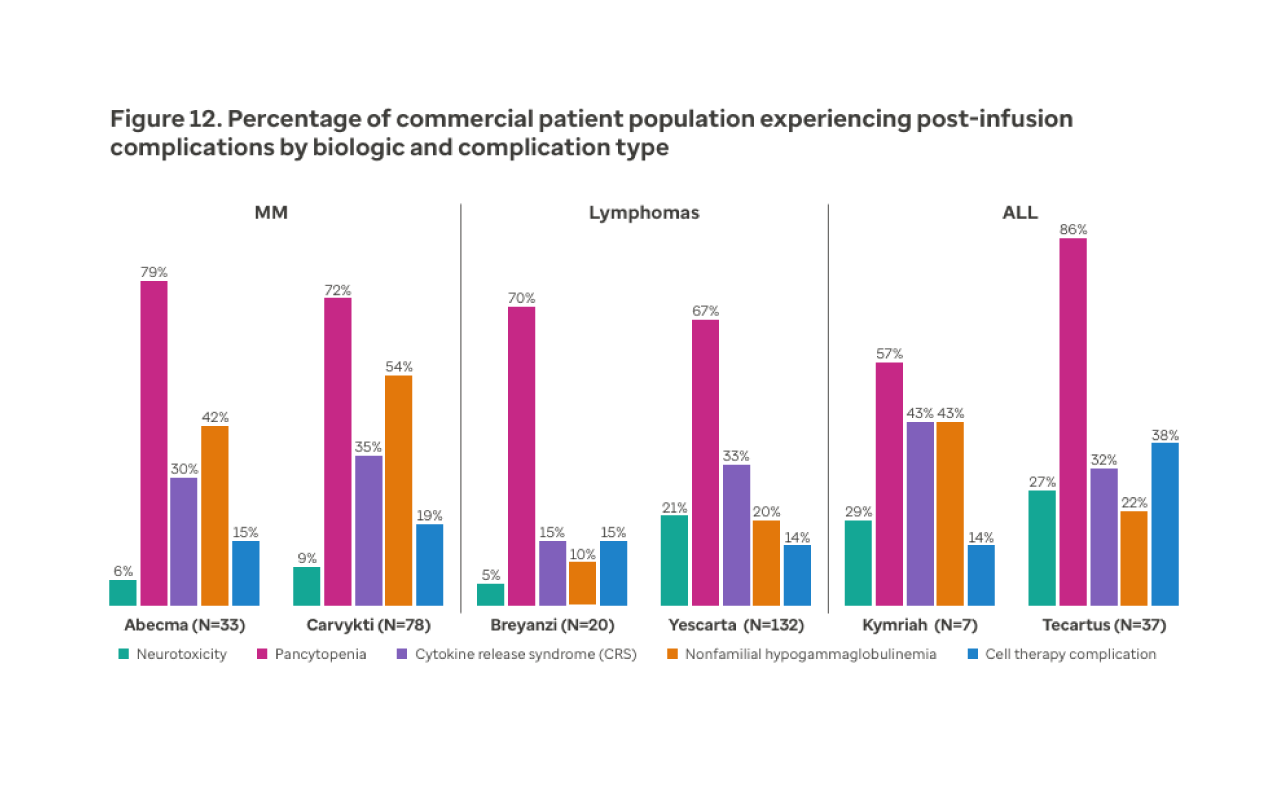
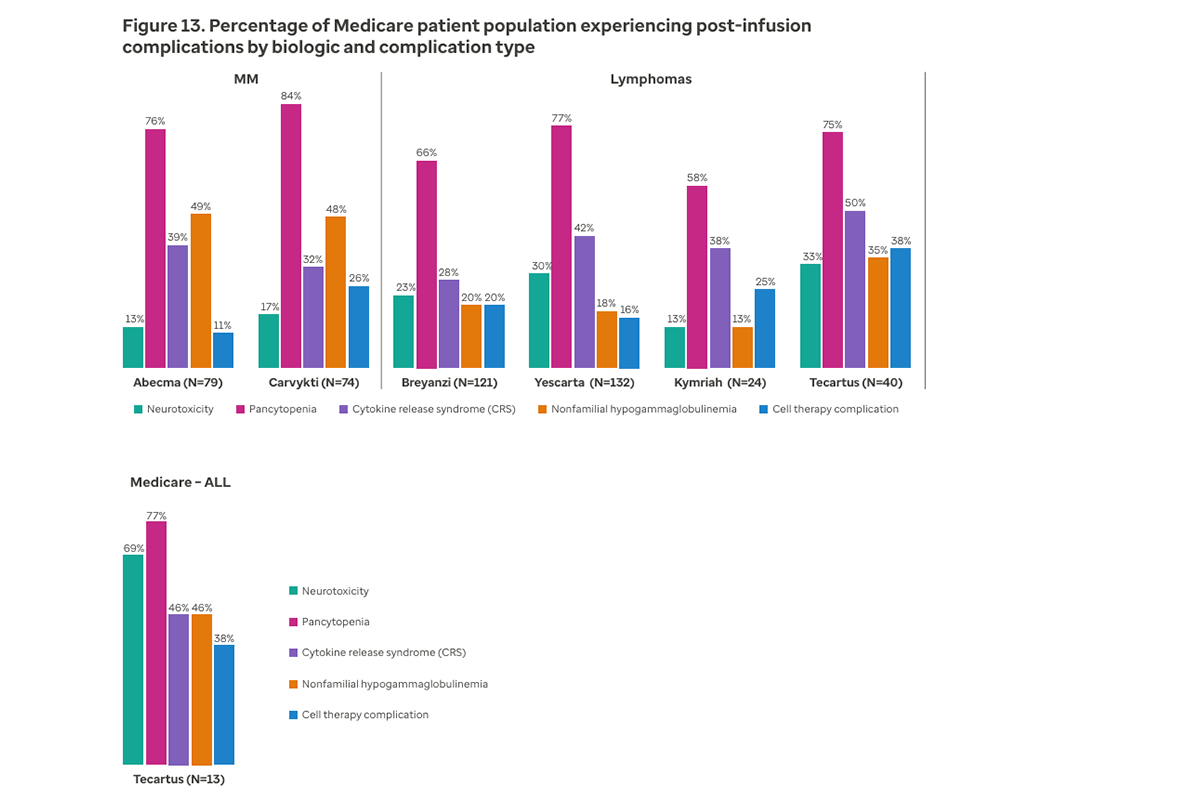
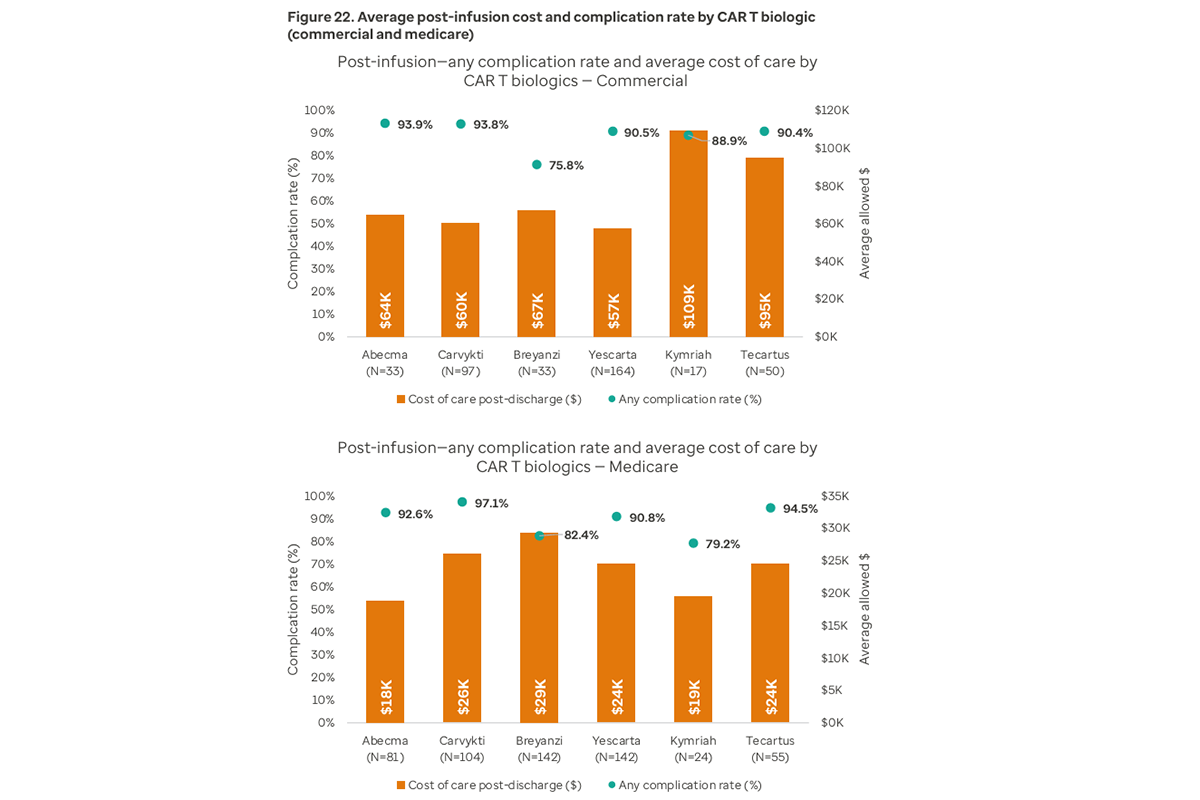
  • While most patients experienced at least one complication (most commonly pancytopenia), the majority had fewer than 2 concurrent complications. This demonstrates that, although side effects are common for CAR T therapy, they are generally manageable.

Economic impact

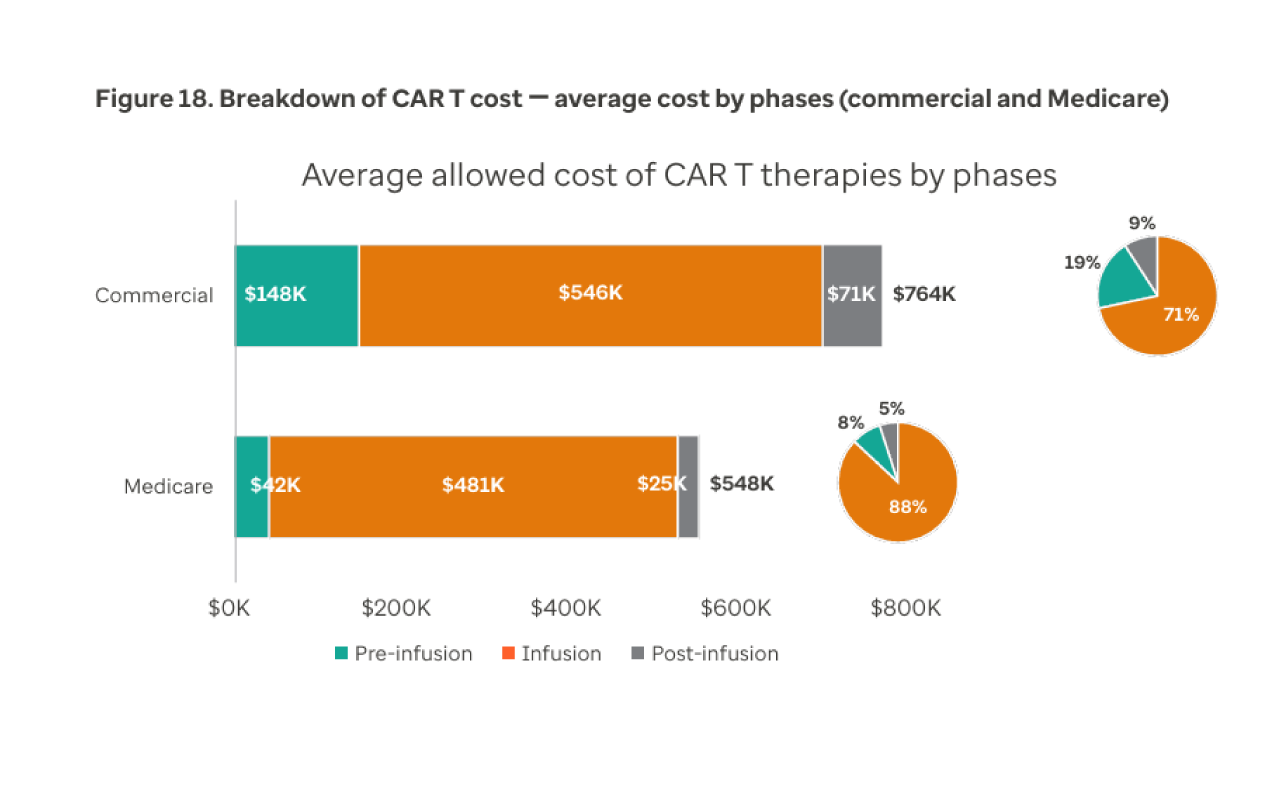
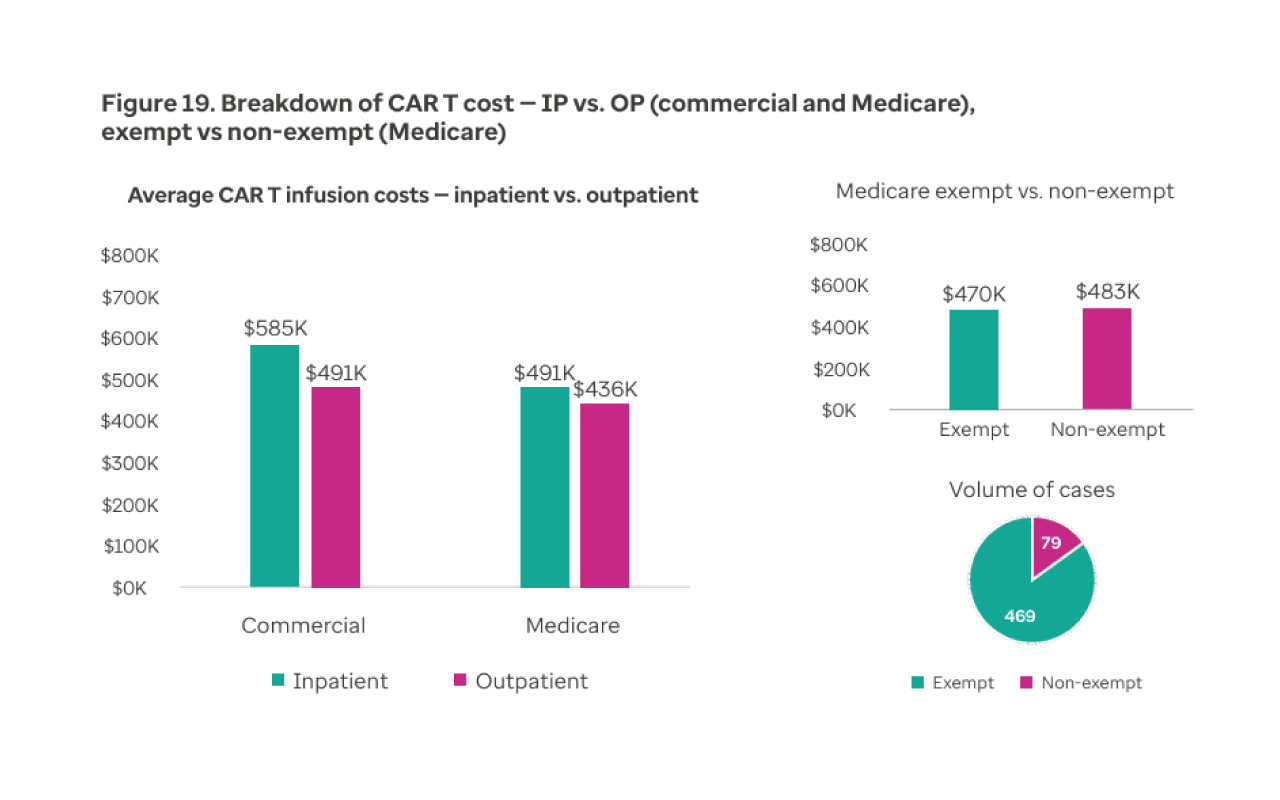
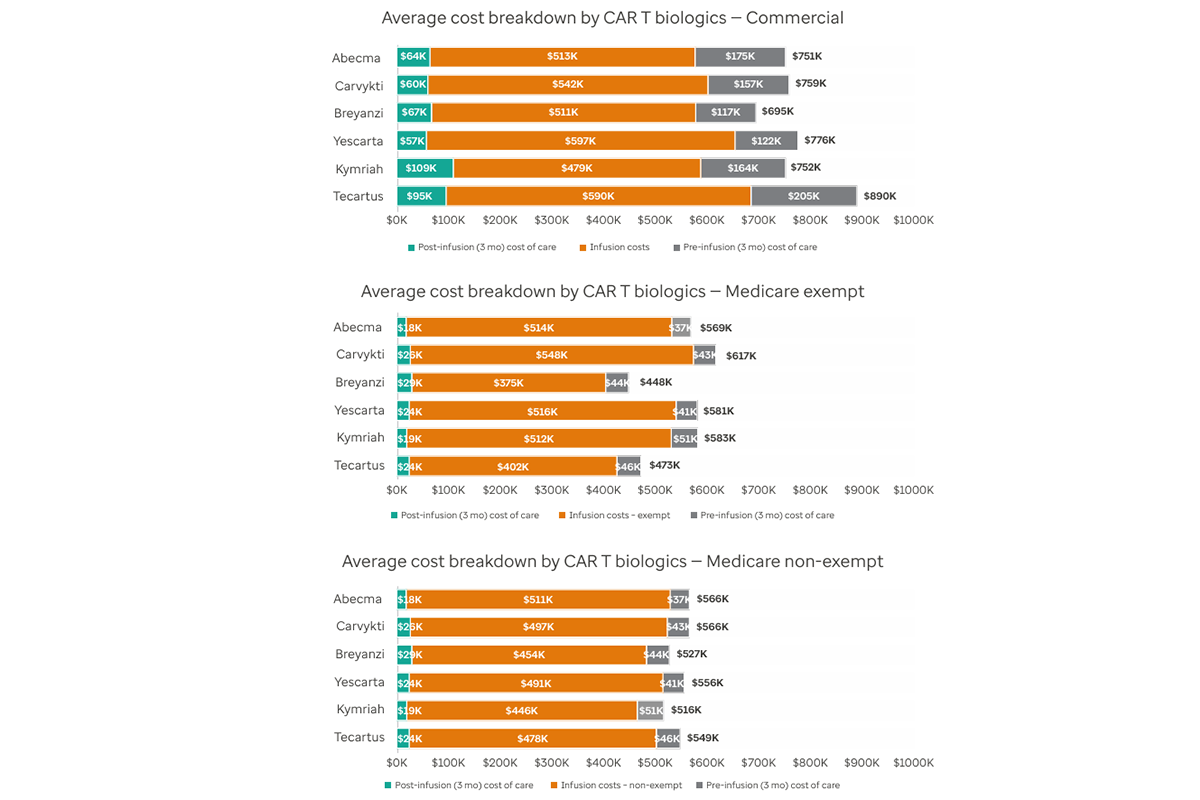
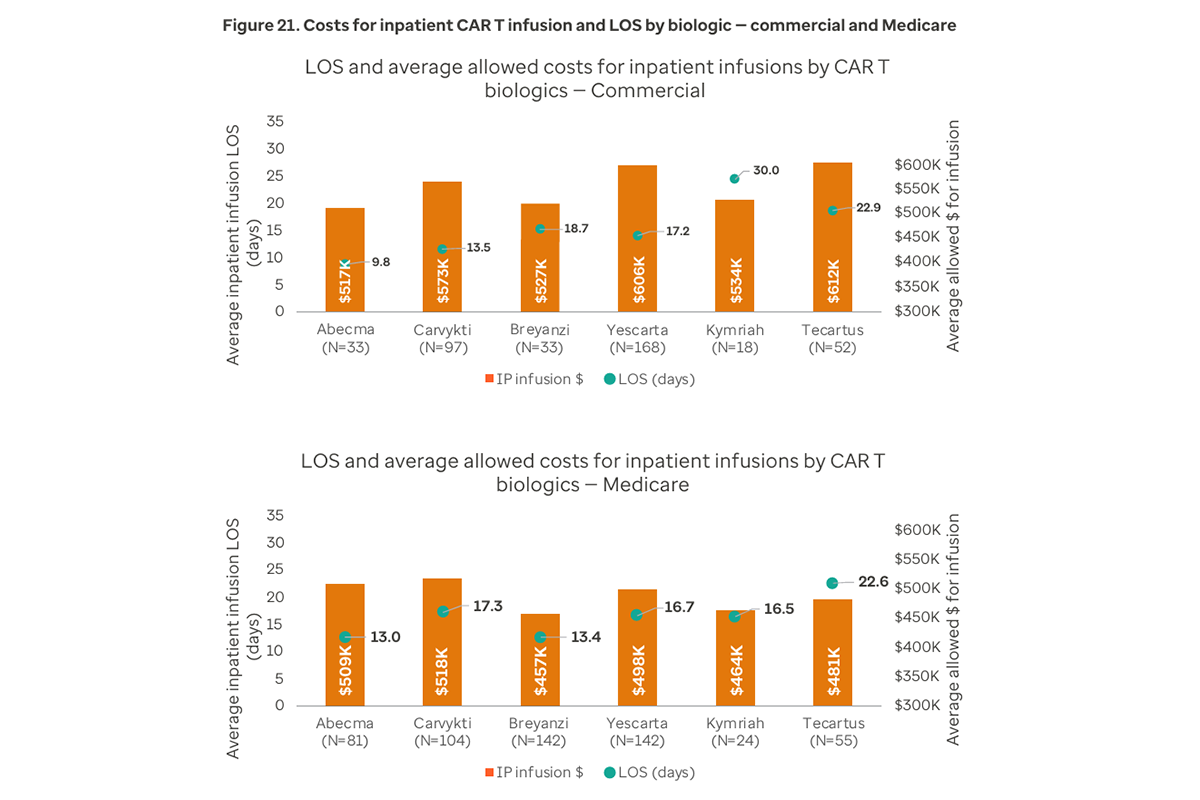
  • The average total cost per case for CAR T therapy is $545,528 for the commercial population and $480,676 for the Medicare population. Outpatient infusions are less expensive than inpatient infusions for both the commercial population ($490,723 vs. $585,483) and the Medicare population ($436,066 vs. $490,987).
  • Among commercial members, the inpatient readmission rate declined by 10 percentage points 3 months post infusion as compared with the pre infusion period.
  • The mean inpatient length of stay (LOS) is 17.3 days for the commercial population and 16.1 days for the Medicare population, with no clear correlation between LOS and cost.
  • Post-infusion costs are lower for Medicare ($24,801) than commercial ($70,728). Complication rates are high but do not directly correlate with post-infusion costs.5

Introduction 

CAR T therapy is an innovative cellular immunotherapy designed to treat select malignancies, including various types of leukemia, lymphoma and myeloma. It differs from other forms of gene therapy, which typically modify patients’ genes to fix a genetic defect. CAR T therapy involves taking a patient’s own immune cells (T cells), modifying them outside the body (ex vivo) to recognize cancer and then reinfusing these “living drugs” into the body to fight disease.

CAR T therapy represents a significant advancement in oncology treatment, offering new hope for patients whose cancers have relapsed or failed to respond to conventional treatments. Notably, CAR T therapy provides unprecedented response rates in patients with relapsed or refractory blood cancers, offering the potential for durable long-term responses and possibly a cure.

CAR T therapy is typically administered as a single dose or infusion, in contrast to traditional treatments that often require much more extensive and prolonged regimens.

Since the first CAR T agent (Kymriah®) was approved by FDA in 2017, CAR T therapy has demonstrated promising results, with clinical trial response rates exceeding 80% .3,4,5

This means that most patients in these trials experienced either a partial or complete response to the treatment and a significant reduction of signs of disease. As of December 2024, 7 CAR T biologics are commercially available and managed under the Optum CAR T program.6

This program has the potential to help clients manage the substantial costs associated with these advanced therapies, while ensuring members have access to a robust network of high-quality treatment centers. Through negotiated case rates, both contractual and through single case agreements, Optum passes savings on to clients by repricing claims and limiting markups on biologics within its network access framework.

For our clients, the CGT program further supports members through comprehensive utilization management and case management services. Utilization management uses proprietary clinical guidelines to inform prior authorization decisions, while specialized case managers provide ongoing education, guidance and risk management to patients throughout their CAR T treatment journey. These services empower patients to make informed choices and help mitigate potential risks during care.

This white paper presents a descriptive analysis of CAR T biologic utilization and outcomes among commercial and Medicare populations who received CAR T infusions through the CGT program between January 1, 2022, and December 31, 2024.

The analysis examines utilization patterns for 6 of the 7 FDA-approved CAR T therapies (excluding Aucatzyl®, which was approved in November 2024 due to insufficient data) and evaluates key outcomes including post-infusion complication rates, relapse, mortality and cost of care.

Methodology and patient demographics

This study analyzed 2 distinct patient populations: those covered by commercial insurance plans and by Medicare. From 2022 to 2024, 949 cases from the CGT program met the full inclusion criteria — 401 commercial and 548 Medicare. All cases had valid insurance coverage with corresponding medical claims, documented evidence of CAR T infusion and excluded clinical trial participants.3

In the commercial cohort 72% were ages 41–65, with 13% over 65 (Medicare eligibles still covered by employer plans) and 5% under 26 (primarily pediatric acute lymphoblastic leukemia cases).4 Notably, 74% of commercial CAR T recipients were male, reflecting the higher prevalence of certain cancers such as B-cell lymphoma and myeloma in men.5

For Medicare cases, 52% were ages 65–74, with 37% over 75 and approximately 11% under 65.6 The age distribution remained stable throughout the 3-year period of the study. In the Medicare group, 60% of CAR T recipients were male.6

Figure 1. Demographics of included members of the analysis — commercial and Medicare2%

Section I: Utilization trends

CAR T therapies are primarily used to treat patients with relapsed or refractory hematologic (blood) cancers. These include large B-cell lymphoma (LBCL), multiple myeloma (MM), acute lymphoblastic leukemia (ALL), follicular lymphoma (FL), and mantle cell lymphoma (MCL).

Analyzing CAR T-cell utilization trends provides insight into how these therapies are being adopted across different patient groups and cancer types. This section summarizes the most frequently used CAR T products, variations in use by indication and insurance type and shifts in treatment settings over time. These insights offer important context for interpreting outcomes and costs in subsequent sections.

CAR T product utilization and trends by biologics and indications

The analysis included 6 FDA-approved CAR T biologic products: Yescarta (axicabtageneciloleucel), Breyanzi (lisocabtagene maraleucel), Tecartus (brexucabtagene autoleucel), Kymriah (tisagenlecleucel), Abecma (idecabtagene vicleucel) and Carvykti (ciltacabtageneautoleucel). Each therapy is indicated for specific types of relapsed or refractory blood cancer, with some overlap among indications.

Table 1 shows that large B‑cell lymphoma made up the biggest share of commercial cases (42%). This was followed by multiple myeloma (27%), acute lymphoblastic leukemia (16%), follicular lymphoma (9%) and mantle cell lymphoma (4%).6

Medicare cases showed a similar pattern, with LBCL and related lymphomas comprising 49% of cases and multiple myeloma representing 32%.6 Notably, the proportion of mantle cell lymphoma was slightly higher in the Medicare population (8%), while follicular lymphoma accounted for 7%.6 Acute lymphoblastic leukemia represented only 2% of Medicare cases, reflecting its lower prevalence among older adults.6

Table 1. Distribution of CAR T cases by cancer indication (comercial and medicare 2022 2024)6

The distribution of CAR T biologic utilization among commercial cases mirrors the breakdown of cancer indications, as illustrated in Figure 2 below. Notably, certain biologics are predominantly prescribed for specific conditions.

For instance, Yescarta is the leading therapy for large B-cell lymphoma (LBCL), accounting for 128 cases (Figure 3) and representing 42% of all commercial CAR T treatments (Figure 2).6 In contrast, Breyanzi has a smaller share, with only 21 cases.6 This difference may be due to Breyanzi’s later FDA approval for LBCL in February 2021, whereas Yescarta was approved in 2017.

Looking ahead, the proportion of patients receiving Breyanzi for LBCL is expected to increase, as it was approved for second-line treatment in 2022 (as was Yescarta in 2022). There were only 7 diffuse large B-cell lymphoma (DLBCL) cases treated with Kymriah.6 This is because Kymriah remains a third-line option for DLBCL and is primarily used for ALL in younger adult and pediatric patients.

Among patients with multiple myeloma, Carvykti is the most frequently administered biologic (78 cases), followed by Abecma (34 cases). Despite Carvykti’s later FDA approval than that of Abecma, it quickly matched Abecma in terms of utilization volume (Figure 3).6 For acute lymphoblastic leukemia (ALL), Tecartus was used in 37 cases, while Kymriah was used in 7 cases.6 Importantly, Kymriah is the sole therapy approved for ALL in patients under 25 years old, making it the preferred option for pediatric cases (Figure 3).

Figure 2. Distribution of CAR T cases by cancer indication and by biologic (Commercial)6

Figure 3. Infusions volume per biologic and stratified by cancer indication (Commercial)64

In the Medicare cohort, Yescarta and Breyanzi dominate use, followed by Carvykti and Abecma. Tecartus is limited to mantle cell lymphoma and accounts for 8% of cases. Kymriah is least used — 20 large B-cell lymphoma cases, 4 follicular lymphoma cases and none in ALL — reflecting its primary role in pediatric ALL (Figure 4).

In contrast to the commercial cohort, the Medicare data do not show strong utilization of Yescarta in the treatment of large B-cell lymphoma. Instead, utilization is nearly evenly split between Yescarta (118 cases) and Breyanzi (119 cases), as shown in Figure 5. A similarly balanced pattern appears in multiple myeloma therapies, with Carvykti accounting for 94 cases and Abecma for 79 cases.

The higher use of Abecma in older populations may be due to its less aggressive toxicity profile post-infusion,7 making it a more suitable option for patients with multiple comorbidities. Overall, Medicare beneficiaries demonstrate a more evenly distributed use of biologic treatments across lymphoma and myeloma indications, whereas commercial cases tend to favor a single product.

Figure 4. Distribution of CAR T cases by cancer indication and by biologic (Medicare)

Figure 5. Infusions volume per biologic and stratified by cancer indication (Medicare)

CAR T product utilization and trends year-over-year

Several notable patterns can be observed. Carvykti usage has consistently increased across both commercial and Medicare populations, while Abecma use for multiple myeloma demonstrated a sharp decline in 2024, falling to one-third of its 2023 volume.

For diffuse large B-cell and follicular lymphoma, Yescarta and Breyanzi remain the leading therapies; however, Yescarta’s usage has decreased by approximately one-third annually, whereas Breyanzi has more than doubled since 2022 — particularly within the Medicare cohort, where it has grown more than threefold.

The increased utilization of Breyanzi in 2024 may be partially attributed to the FDA approval of 3 new indications (follicular lymphoma, chronic lymphocytic leukemia (CLL) and small lymphocytic lymphoma (SLL)) for the product that year. Tecartus and Kymriah continue to have low and stable utilization rates across both populations.

Overall, Medicare trends mirror those observed in the commercial population, but with higher volumes for Abecma and Breyanzi, which significantly influence the combined utilization patterns (Figure 6).

Figure 6. Utilization trend year-over-year by biologic (commercial and Medicare)

CAR T product utilization and trends by site of treatment (inpatient vs. outpatient)

Most CAR T infusions were performed in inpatient hospital settings, reflecting the need for close monitoring due to the potential post-infusion risks such as cytokine release syndrome (CRS) and neurotoxicity. Between 2022 and 2024, 77% of commercial and 78% of Medicare CAR T infusions occurred in inpatient environments.

Notably, the proportion of outpatient infusions has increased steadily, with outpatient cases rising from 18% of all cases in 2022 to 31% of all cases in 2024 in the commercial population and from 11% to 34% in the Medicare population over the same period (Figure 7). Key drivers of the observed shift in care setting may be attributed to a combination of clinical safety progress, supportive policy changes, economic factors and operational benefits.

Advancement in clinical safety

Early CAR T trials mandated inpatient monitoring because of severe acute toxicities like CRS and neurotoxicity (ICANS). In recent years, clinical improvements have made outpatient CAR T much safer and more feasible.

The advent of standardized grading and management guidelines (e.g., ASTCT guidelines for CRS/ICANS), along with wider availability of rescue medications, means serious CAR T side effects can be managed on an outpatient basis with rapid intervention or inpatient transfer when needed. In addition, centers have developed patient selection criteria to triage patients into outpatient versus inpatient pathways. CAR T products approved in recent years tend to have slightly more favorable safety profiles in terms of high-grade CRS frequency.8

Relaxation in regulatory requirements

CMS now allows Medicare coverage of CAR T‑cell therapy in the outpatient hospital setting, provided treatment occurs at an authorized center. CMS established new HCPCS codes and corresponding outpatient payment rates, enabling hospitals to bill for CAR T products through the Hospital Outpatient Prospective Payment System (OPPS).

As of June 2025, the FDA has removed REMS (risk evaluation and mitigation strategy) requirements for all CAR T therapies, recognizing the strong clinical guidelines and the extensive experience of hematology and oncology specialists in managing cytokinerelease syndrome (CRS) and neurologic toxicities.9 It is expected this regulatory change will accelerate the shift toward administering CAR T therapy in outpatient settings.

Economic drivers and operational efficiencies

Outpatient CAR T-cell administration is associated with lower delivery costs, generating efficiencies that benefit health plans, hospitals and patients. Compared with inpatient care, outpatient treatment episodes cost significantly less on average, driven by reduced hospitalization rates and shorter lengths of stay.

These reductions lower overall health care resource utilization and ease pressure on limited inpatient bed capacity. Median hospitalization duration for outpatient CAR T-cell administration is approximately 2 to 3 times shorter than for inpatient administration.10

Outpatient CAR T-cell treatment expands system capacity by enabling centers to manage more patients without the need to add inpatient beds. Unlike inpatient care, where a patient may occupy a hospital bed for a week or longer, outpatient infusion typically requires only a few hours of chair time, allowing more efficient use of personnel and facilities.

This shift enables centers to treat a greater number of patients annually using existing resources, improving the economic performance of CAR T programs. These gains are particularly important given the high fixed costs associated with delivering CAR T-cell therapy.

Figure 7. Utilization volume IP vs. OP setting by year (commercial and Medicare)

The distribution of treatment sites among CAR T biologics highlights several important trends across indications. For multiple myeloma, more than 41% of commercial members received Carvykti in an outpatient setting, compared with less than 9% for Abecma.

A similar, though less pronounced, pattern was observed in the Medicare population, with 35% of Carvykti infusions administered outpatient versus 14% for Abecma. For large B-cell and follicular lymphomas, Breyanzi was more frequently delivered in outpatient settings — 42% for commercial and 37% for Medicare — while Yescarta was administered outpatient to only 12% of commercial and 8% of Medicare patients.

Tecartus, primarily used for treating mantle cell lymphoma and ALL in adult patients, was predominantly administered in inpatient settings (87% in the commercial group). In contrast, Kymriah, which is indicated for younger ALL patients, was given in outpatient settings 55% of the time among commercial members — a trend not observed in the Medicare population, likely due to differences in age distribution and cancer indications, as Kymriah is used predominantly for lymphomas rather than ALL in Medicare population (Figure 8).

Figure 8. Infusion in IP vs. OP setting by biologic commercial and Medicare

Among biologics with a higher proportion of outpatient infusions, specifically Breyanzi and Carvykti, the percentage of outpatient infusions has generally increased year over year for both commercial and Medicare populations. Although Kymriah also demonstrates higher outpatient utilization, it was excluded from the year-over-year comparison due to its small sample size (fewer than 10 cases per year). Notably, there was a dramatic increase in outpatient infusion cases for Carvykti within the Medicare population in 2024 (Figure 9).

Figure 9. Year-over-year Breyanzi and Carvykti outpatient cases (as percentage of all cases)

Section II: Post-infusion outcomes

The analysis evaluated quality outcomes within 3 months following CAR T infusion, focusing on treatment-related complications, post-infusion mortality rate, and the need for additional cancer therapies or emergency department visits.

Complications

Post–CAR T infusion complications were tracked across 10 predefined adverse events during the first 3 months following infusion. These included neurotoxicity, pancytopenia, cytokine release syndrome (CRS), nonfamilial hypogammaglobulinemia and other cell therapy–related complications. In the commercial population, 90% of patients experienced at least one complication, with pancytopenia being the most common (71%), followed by CRS and nonfamilial hypogammaglobulinemia (each 30%), cell therapy–related complications (18%) and neurotoxicity (15%) (Figure 10).

A similar pattern was observed in the Medicare population, where 93% of patients experienced at least one complication within 3 months post-infusion. Pancytopenia again predominated (77%), with the same subsequent complications occurring in similar rank order. Overall complication rates were higher in the Medicare cohort, which may reflect differences in age and baseline risk profiles between the populations (Figure 10).

Figure 10. Percentage of patients experiencing post-infusion complications by complication type (commercial and Medicare)

We further analyzed the distribution of cases by the number of complications observed for each biologic across both commercial and Medicare populations. Cases were grouped by the number of distinct complication types occurring post-infusion, ranging from none to more than 6 (Figure 11). Distinct patterns in complication burden were observed across biologics.

In the commercial cohort, Breyanzi was associated with the lowest proportion of cases experiencing multiple complications (3 or more types). In contrast, Yescarta — which, like Breyanzi, is primarily used in the treatment of LBCL — showed a higher proportion of cases with fewer complications (fewer than 2 types) in both commercial and Medicare populations (Figure 11). Differences in post-infusion complication burden may help explain observed shifts in biologic utilization, including increased use of Breyanzi relative to Yescarta, particularly within the Medicare population.

Figure 11. Percentage of patients experiencing post-infusion complications by biologic and severity

Next, we deep dived into post-infusion complications by biologic and complication type, grouping the 6 CAR T therapies according to their primary indications: Abecma and Carvykti for multiple myeloma (MM); Breyanzi and Yescarta for lymphoma (LBCL, FL and MCL); and Kymriah and Tecartus for acute lymphoblastic leukemia (ALL). Across both commercial and Medicare populations, each biologic exhibited a distinct complication profile.

Within the commercial cohort, Carvykti demonstrated higher complication rates than Abecma across 4 of the 5 complication categories examined, except for pancytopenia. Among lymphoma indications, Yescarta was associated with a higher overall complication rate than Breyanzi, particularly for cytokine release syndrome (CRS). For ALL, the number of Kymriah cases was small (N=7) due to its limited age indication, limiting direct comparison. However, Tecartus exhibited a distinct complication profile relative to Kymriah and had the highest rate of post-infusion pancytopenia among all biologics.These differences between Kymriah and Tecartus may reflect variation in the age populations targeted by each therapy (Figure 12).

In the Medicare population, Carvykti similarly showed higher complication rates across 3 complication categories compared with Abecma, with the exception of CRS and nonfamilial hypogammaglobulinemia. Notably, Carvykti had the highest pancytopenia rate among all biologics in this population.

Among lymphoma indications — primarily LBCL and FL — Breyanzi, Yescarta, and Kymriah displayed distinct complication profiles, with Kymriah showing the lowest overall complication burden. Tecartus cases differed from the other lymphoma therapies, as all Tecartus lymphoma cases treated mantle cell lymphoma (MCL), whereas the other biologics primarily treated LBCL and FL.

In addition, 13 ALL cases treated with Tecartus in the Medicare population exhibited high complication rates across all examined categories, which may be associated with the older age distribution of this population (Figure 13).

Figure 12. Percentage of commercial patient population experiencing post-infusion 
complications by biologic and complication type

Figure 13. Percentage of Medicare patient population experiencing post-infusion complications by biologic and complication type

Mortality rate

Among commercial members, the estimated all-cause mortality rate within 3 months following discharge was 3.9% (17 of 433 included cases for this analysis), with an additional 1.8% (8 cases) occurring between 3 months and one-year post-infusion. In contrast, the Medicare cohort (531 cases included) experienced higher post-infusion mortality rates: 8.4% within 3 months and14.4% between 3 months and one year after discharge (Figure 14).

These differences are likely driven by demographic factors — most notably, age — since the commercial group comprises a higher proportion of younger patients than the Medicare population. It is important to note that these estimates reflect all-cause mortality; the data do not distinguish deaths attributable to disease relapses, treatment-related complications, comorbid conditions or unrelated causes (e.g., accidental injury).

Figure 14. Overall post-infusion mortality rate (commercial and Medicare)

Figure 15 reveals significant differences in mortality rates among the 6 CAR T biologics across 3 primary disease categories: multiple myeloma (MM), lymphomas (LBCL, FL and MCL) and acute lymphoblastic leukemia (ALL). Both lymphomas and ALL exhibit higher mortality rates than MM, a trend especially pronounced in the Medicare population.

For Medicare patients with MM, Carvykti is associated with a higher post-infusion mortality rate than Abecma, whereas the opposite is observed in the commercial population. In cases of lymphoma, Yescarta shows a higher mortality rate than Breyanzi among commercial members, a distinction not seen in Medicare.

In the context of ALL, Kymriah has comparable mortality rates with Tecartus in the commercial group. It is important to note that direct comparisons between Kymriah and Tecartus for ALL within Medicare are no longer appropriate. This is because all Kymriah cases in the Medicare cohort now involve lymphomas (LBCL and FL) rather than ALL, and Tecartus is primarily used for mantle cell lymphoma (40 cases) with 13 ALL cases in this group (Figure 15). Overall, these findings highlight the variability in outcomes based on both the specific CAR T biologic and the insurance group.

Figure 15. Post-infusion mortality rate by biologics and cancer indication (commercial and Medicare)

Evidence of relapse

While claims data do not allow us to directly assess the success of CAR T therapy, they do provide insight into subsequent treatment patterns that may suggest suboptimal outcomes. Specifically, the occurrence of chemotherapy or bone marrow transplants after CAR T infusion can indicate that the initial therapy may not have achieved the desired result.

Within 3 months post-infusion, our analysis found that 2.1% of commercial patients underwent a bone marrow transplant and 1.8% received at least one chemotherapy treatment. This contrasts sharply with the pre-infusion rates, where 66.4% of patients received chemotherapy and 5.5% underwent bone marrow transplantation.

Among Medicare patients, none received a bone marrow transplant post-infusion, and 1.7% received chemotherapy, compared with pre-infusion rates of 4.6% for bone marrow transplants and 75.5% for chemotherapy (Figure 16). These findings demonstrate a substantial reduction in the need for subsequent chemotherapy and bone marrow transplantation following CAR T-cell therapy, suggesting that most treated patients achieved favorable clinical outcomes.

It is important to note that there is overlap among these patients. Many who received a bone marrow transplant also underwent chemotherapy. This overlap is expected, as chemotherapy is commonly used as a preparative or conditioning regimen before bone marrow transplantation.

Figure 16. Chemo treatment and bone marrow transplants rate pre- and post-infusion (commercial and Medicare) )

Additional quality outcomes assessed included emergency department (ED) visits and inpatient hospital readmissions following CAR T-cell infusion. The proportion of patients experiencing at least one ED visit within 3 months post-infusion was lower than the corresponding pre-infusion rate in both the commercial and Medicare cohorts, with the reduction being less pronounced in the Medicare population (Figure 17).

One contributing factor to the reduction in post-infusion ER visits may be the case management services provided by the Optum CGT program, which helps coordinate care, facilitate discharge planning, ensure medication adherence and assess patients’ post-infusion needs. It is important to note that the data did not exclude ER visits due to factors unrelated to blood malignancies.

Regarding inpatient care, the readmissions rate decreased by 10 percentage points post-infusion compared with the pre-infusion period in the commercial cohort, whereas a 1 percentage point increase was observed in the Medicare cohort (Figure 17). It should be noted that inpatient readmissions may be attributable to factors unrelated to CAR T-cell therapy, particularly in the Medicare population, which is characterized by a higher risk score than the commercial population.

Figure 17. ER visits and inpatient readmission rate pre- and post-infusion (commercial and Medicare)

Section III: Economic impact

CAR T-cell therapy is among the most expensive therapies available today. Understanding and managing the cost of CAR T is critical — not only because of the significant financial impact on health plans and patients, but also to ensure that these life-changing treatments remain accessible.

In the following sections, we present a detailed cost analysis, examining average paid charges, length of stay and post-infusion care costs across both commercial and Medicare populations to provide a comprehensive view of the economic impact of CAR T therapy.

Cost analysis — CAR T average cost at different phases

The Optum CGT program is designed to help clients achieve savings on CAR T therapies, with a particular focus on reducing markups associated with biologic costs. For this analysis, each CAR T case was divided into 3 distinct phases: pre-infusion (the 3 months prior to treatment), = infusion and post-infusion (the 3 months following treatment).

The infusion phase includes the cost of biologic and represents the majority of total expenses — accounting for 71% of overall costs in the commercial cohort and 88% in the Medicare cohort. This distribution reflects the complexity and intensity of the infusion process, although significant care requirements and costs are also incurred before and after treatment.

In the commercial cohort, the average total cost for CAR T infusions — including both biologic and medical treatment expenses — was $545,528. Pre-infusion costs averaged $148,043, primarily driven by preparatory cancer treatments, while post-infusion costs averaged $70,728, largely due to the management of complications and relapses (Figure 18).

Medicare cases consistently incur lower costs across all 3 phases. The average total cost for treating Medicare patients was $480,676. Similar to the commercial cohort, the pre-infusion and post-infusion phases accounted for a smaller proportion of the total cost in the Medicare population, with preinfusion costs averaging $42,478 and post-infusion costs averaging $24,801 (Figure 18).

Figure 18. Breakdown of CAR T cost  average cost by phases (commercial and Medicare)

When comparing inpatient and outpatient settings, the mean paid amount for inpatient CAR T infusions was $585,483, while outpatient infusions incurred a lower mean cost of $490,723. For Medicare members, the average cost of care for inpatient infusions was $490,987, compared with $436,066 for outpatient infusions.

Additionally, an analysis of costs between IPPS-exempt and non-exempt facilities within the Medicare population revealed a slight difference: the average infusion cost was $469,604 at exempt facilities (79 cases) and $482,562 at non-exempt facilities (469 cases) (Figure 19).

Figure 19. Breakdown of CAR T cost IP vs. OP (commercial and Medicare), exempt vs non exempt (Medicare)

The lower costs observed in Medicare compared to commercial plans are primarily due to differences in reimbursement structures. Medicare reimburses hospitals with a bundled payment for inpatient treatment based on a specific Medicare Severity Diagnosis Related Group (MS-DRG), while commercial plans allow for greater flexibility in negotiating reimbursement rates directly with treatment centers.

This cost pattern occurs across all 6 CAR T therapies analyzed, with the infusion phase representing the largest share of total costs and overall expenses remaining lower for Medicare beneficiaries than for commercial members. However, infusion prices varied among different biologics, particularly among Medicare patients treated at exempt facilities. For example, there are substantial differences in infusion costs between Breyanzi and Yescarta at Medicareexempt facilities, as well as between Kymriah and Tecartus.

These cost differentials were not evident among members treated at non-exempt facilities (Figure 20). Additional analysis is needed to determine whether these variations are primarily attributed to differences in biologic prices and markups or to underlying medical services costs.

Figure 20. Breakdown of CAR T cost by infusion phases and by biologic (commercial and Medicare)

Cost analysis — length of stay and average allowed costs per biologic

The mean inpatient length of stay (LOS) for CAR T infusion in the commercial cohort was 17.3 days. As shown in Figure 21, LOS varied by product, with Kymriah recipients exhibiting a mean LOS of 30 days and Abecma recipients a mean LOS of 10 days. This difference reflects the underlying cancer types treated — acute lymphoblastic leukemia (ALL) cases, typically treated with Kymriah, generally require longer hospital stays than multiple myeloma cases, which are treated with Abecma.

In the Medicare cohort, the mean inpatient LOS was 16.1 days. LOS by product ranged from 22.6 days for Tecartus to 13.0 days for Abecma. As shown below, costs for inpatient CAR T infusions ranges from $517K to $612K for commercial and from $457K to $518K for Medicare population (Figure 21). No clear correlation was observed between LOS and medical costs in either commercial or Medicare population.

Figure 21. Costs for inpatient CAR T infusion and LOS by biologic commercial and Medicare

Cost analysis — post-infusion cost and complication rate analysis

We also evaluated post infusion costs for each CAR T therapy to examine potential links with complication rates. Mean 3 month post infusion costs were $70,728 in the commercial cohort and $24,801 in Medicare. In the commercial group, 90% of patients experienced at least one complication; Breyanzi showed the lowest complication rate (75.8%), while Kymriah had the highest mean post infusion cost ($109K).

In Medicare, complication rates were higher across all biologics, but overall costs were lower. Kymriah showed the lowest Medicare complication rate (79.2%), whereas Breyanzi had the highest mean post infusion cost ($29K). It is important to note that differences in underlying blood cancer types may primarily account for the cost variations observed among different biologics. No correlation emerged between complication rates and post infusion costs in either cohort (Figure 22).

Figure 22. Average post-infusion cost and complication rate by CAR T biologic (commercial and medicare)

Related healthcare insights

Article

How transplant care can guide cell and gene therapy management

Payers facing rising CGT costs and complexity can draw on decades of transplant care experience to improve systems for coordination, risk management and patient support.

Article

Fecal transplant to treat recurrent urinary tract infection

Learn how leveraging a microbiome approach helped one patient with von Willebrand disease and multiple antibiotic allergies.

Article

Second Opinion plus COEs can help address avoidable MSK surgeries 

Musculoskeletal surgeries are driving up costs. Payers can bend the curve with digital care, expert second opinions and high-performing surgical centers.

  1. Gouni S, Nastoupil LJ, Westin JR et al. When can we define cure after CAR-T therapy in LBCL? Insights from serial landmark analyses. Blood. 2024;144(Supplement 1):2369.
  2. Lal LS, Blauer-Peterson C, DaCosta Byfield S, Malin J. Real-world evidence (RWE) study of CAR-T agents in leukemia and lymphoma patients. J Clin Oncol. 2021;39:e19573–e19573.
  3. Wang D, Wang J, Hu G et al. A phase 1 study of a novel fully human BCMA-targeting CAR (CT103A) in patients with relapsed/refractory multiple myeloma. Blood. 2021;137(21):2890–2901.
  4. Locke FL, Ghobadi A, Jacobson CA et al. Long-term safety and activity of axicabtagene ciloleucel in refractory large B-cell lymphoma (ZUMA-1): A single-arm, multicentre, phase 1–2 trial. Lancet Oncol. 2019;20(1):31–42.
  5. Zhao Y, Zhang J, Yang J et al. Long-term safety and efficacy of CD19 humanized selective CAR-T therapy in B-ALL patients who have previously received murine-based CD19 CAR-T therapy. Front Oncol. 2022;12:884782.
  6. Optum claims, all CAR T cases, Jan. 1, 2018, to Dec. 31, 2024.
  7. Hansen DK, Peres LC, Dima D et al. Comparison of standard-of-care idecabtagene vicleucel and ciltacabtagene autoleucel in relapsed/refractory multiple myeloma. J Clin Oncol. 2025;43(11):1399.
  8. Gatwood K, Mahmoudjafari Z, Baer B et al. Outpatient CAR T-cell therapy as standard of care: Current perspectives and considerations. Clin Hematol Int. 2024;6(2):11–20.
  9. FDA. FDA Eliminates Risk Evaluation and Mitigation Strategies (REMS) for Autologous Chimeric Antigen Receptor (CAR) T cell Immunotherapies. Published June 26, 2025.
  10. Furqan F, Bhatlapenumarthi V, Dhakal B et al. Outpatient administration of CAR T-cell therapies using a strategy of no remote monitoring and early CRS intervention. Blood Adv. 2024;8(16):4320–4329.